Maria Cuenca-Cambronero
Stats and Illustrations
Statistical analysis
I began developing my statistical skills during my MSc studies at the Biological Station of Doñana (EBD-CSIC), where I enrolled in an advanced course on statistics in R taught by Roger Mundry, an expert in statistical modelling. This course provided me with a solid foundation in generalised and linear models. During this period, I also acquired basic training in ArcGIS, including programming, coordinate systems, and georeferencing, by completing a specialised course at EBD-CSIC.
My statistical expertise deepened significantly during my PhD, where I built a strong background in the use of R, applying a range of techniques such as meta-analysis, generalised linear mixed models, and phenotypic trajectory analysis. I benefited from the support of Prof. Andrew Beckerman (University of Sheffield, UK), co-author of Getting Started with R: An Introduction for Biologists. In addition, I expanded my skills to genomic data analysis by taking courses such as Environmental Genomics and Introduction to Metabolomics for Environmental Scientists at the University of Birmingham. These trainings, combined with my thesis work, gave me hands-on experience in bioinformatic, byt the analsysi and handle of complex genomic database (data extracted from Daphnia experiments, DNA and RNA), population genomics, SNP calling, outlier detection, and GWAS analysis.
During my first postdoctoral position, I further strengthened my statistical expertise by assembling high-resolution ecological datasets. This involved the collection and analysis of ecosystem parameters over eight months using automated multiparameter sondes, which necessitated robust statistical treatment. In my second postdoctoral position, I gained extensive experience with large-scale, long-term datasets spanning eight different countries. In my current research, I focused on advanced methods such as multifunctionality analysis, structural equation modeling, and network analysis. To consolidate and expand this expertise, I conducted a research stay with Prof. Manuel Delgado-Baquerizo (IRNAS-CSIC, Seville), a leading expert in multifunctionality and ecological statistical analysis. Some of the statistical analyses I use include: GLMM models, phenotypic traits analysis (PTA), partitioning metrics analysis, SEM, random forest analysis, network analysis, etc.
Illustration skills
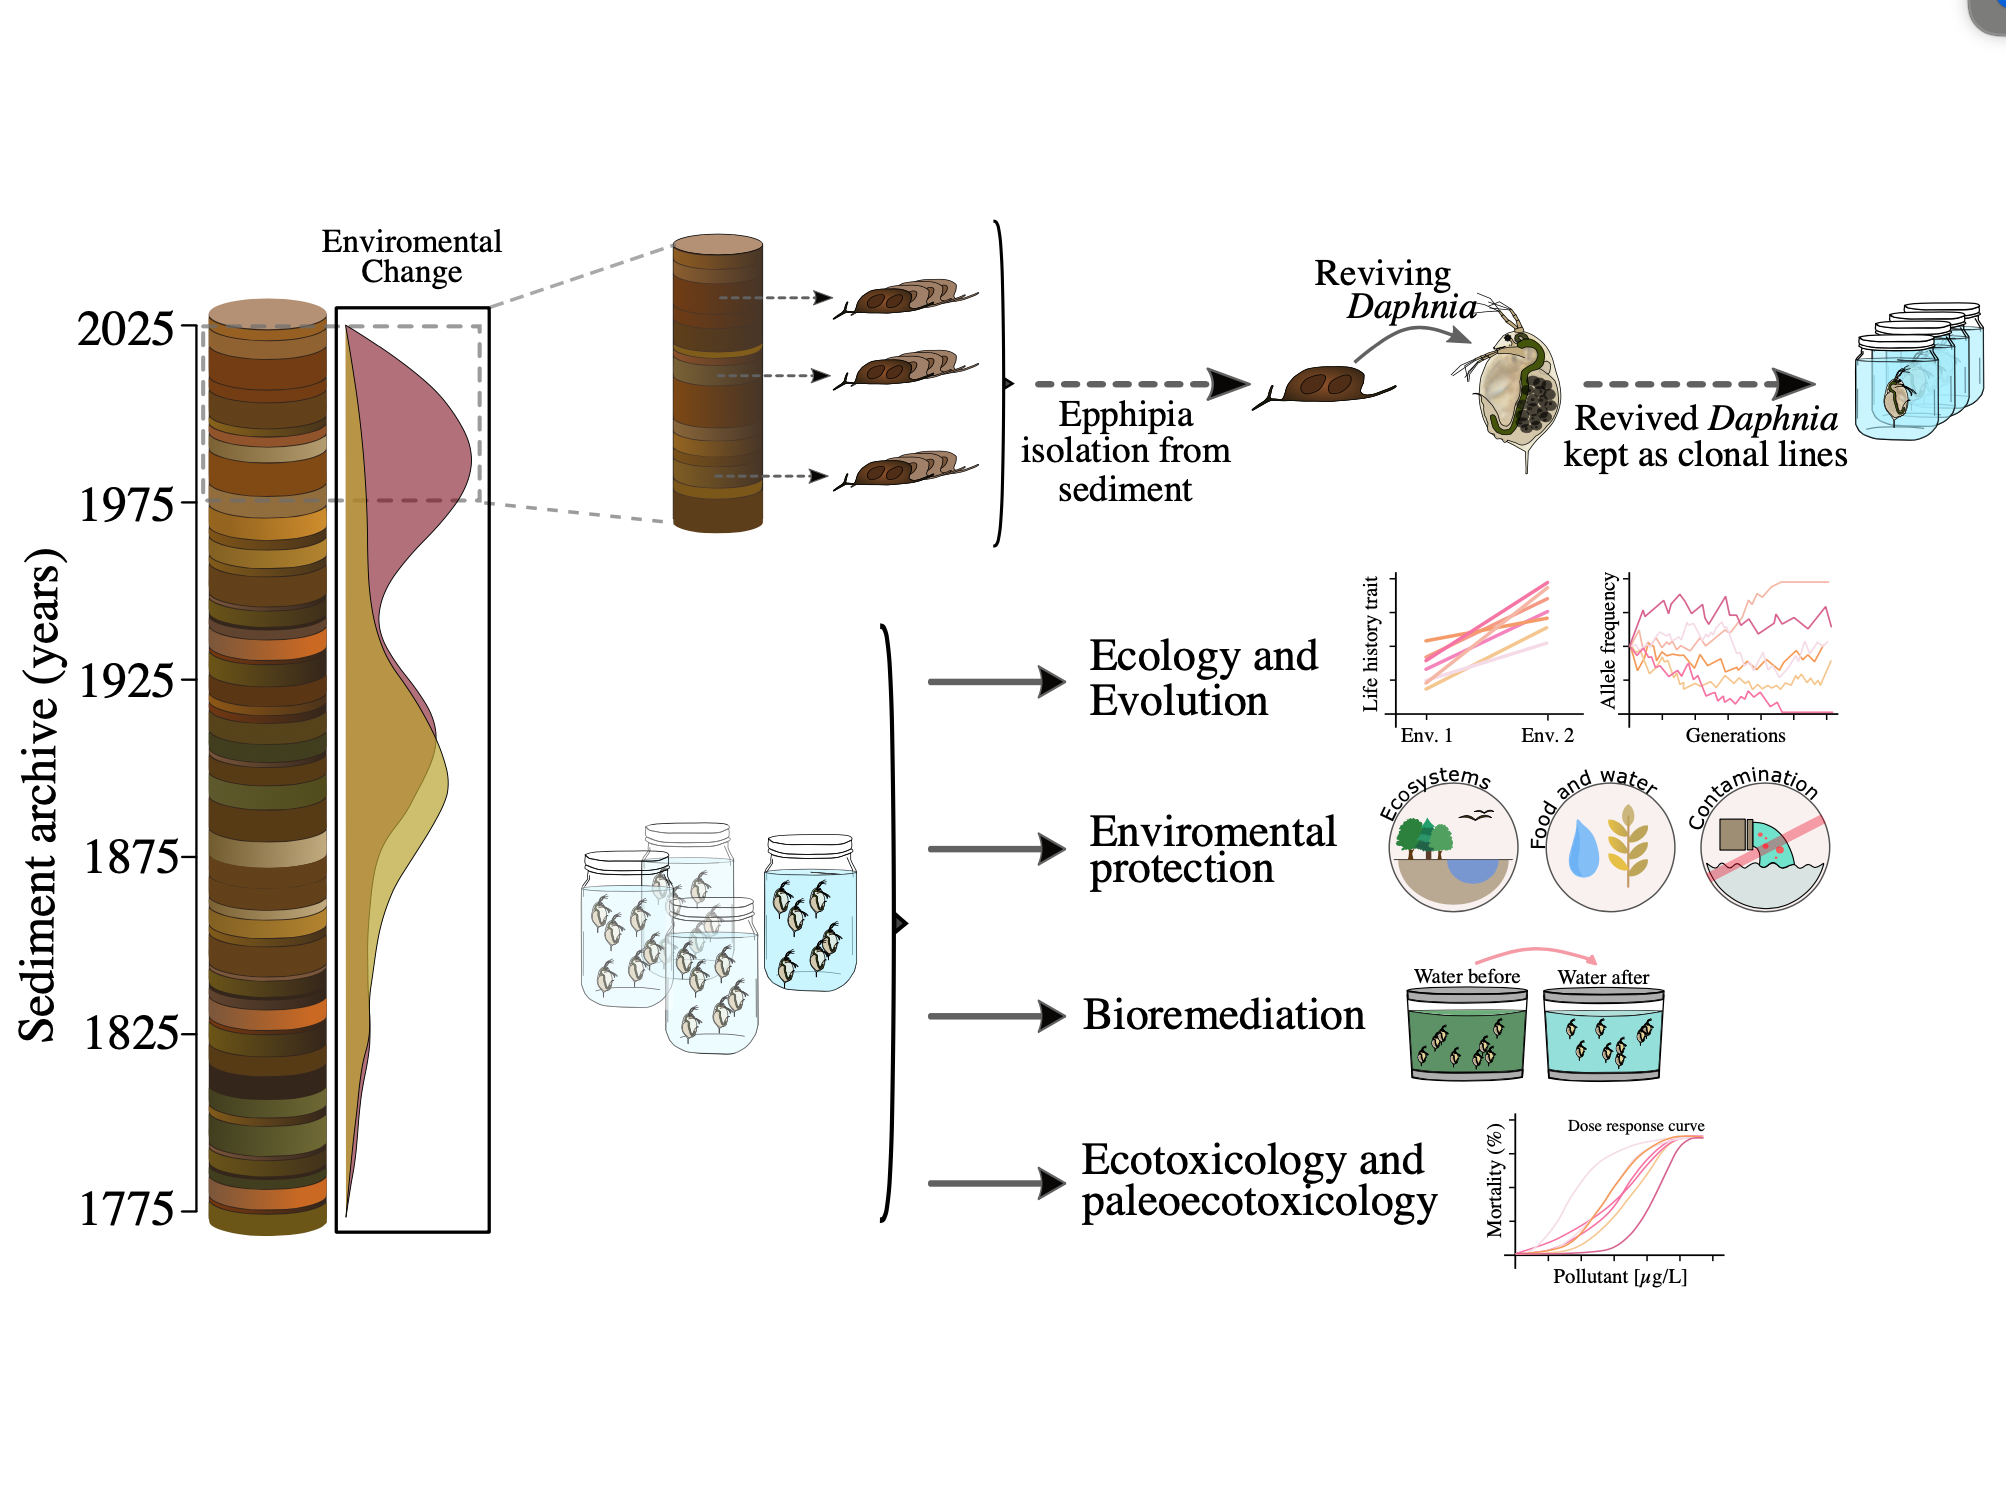
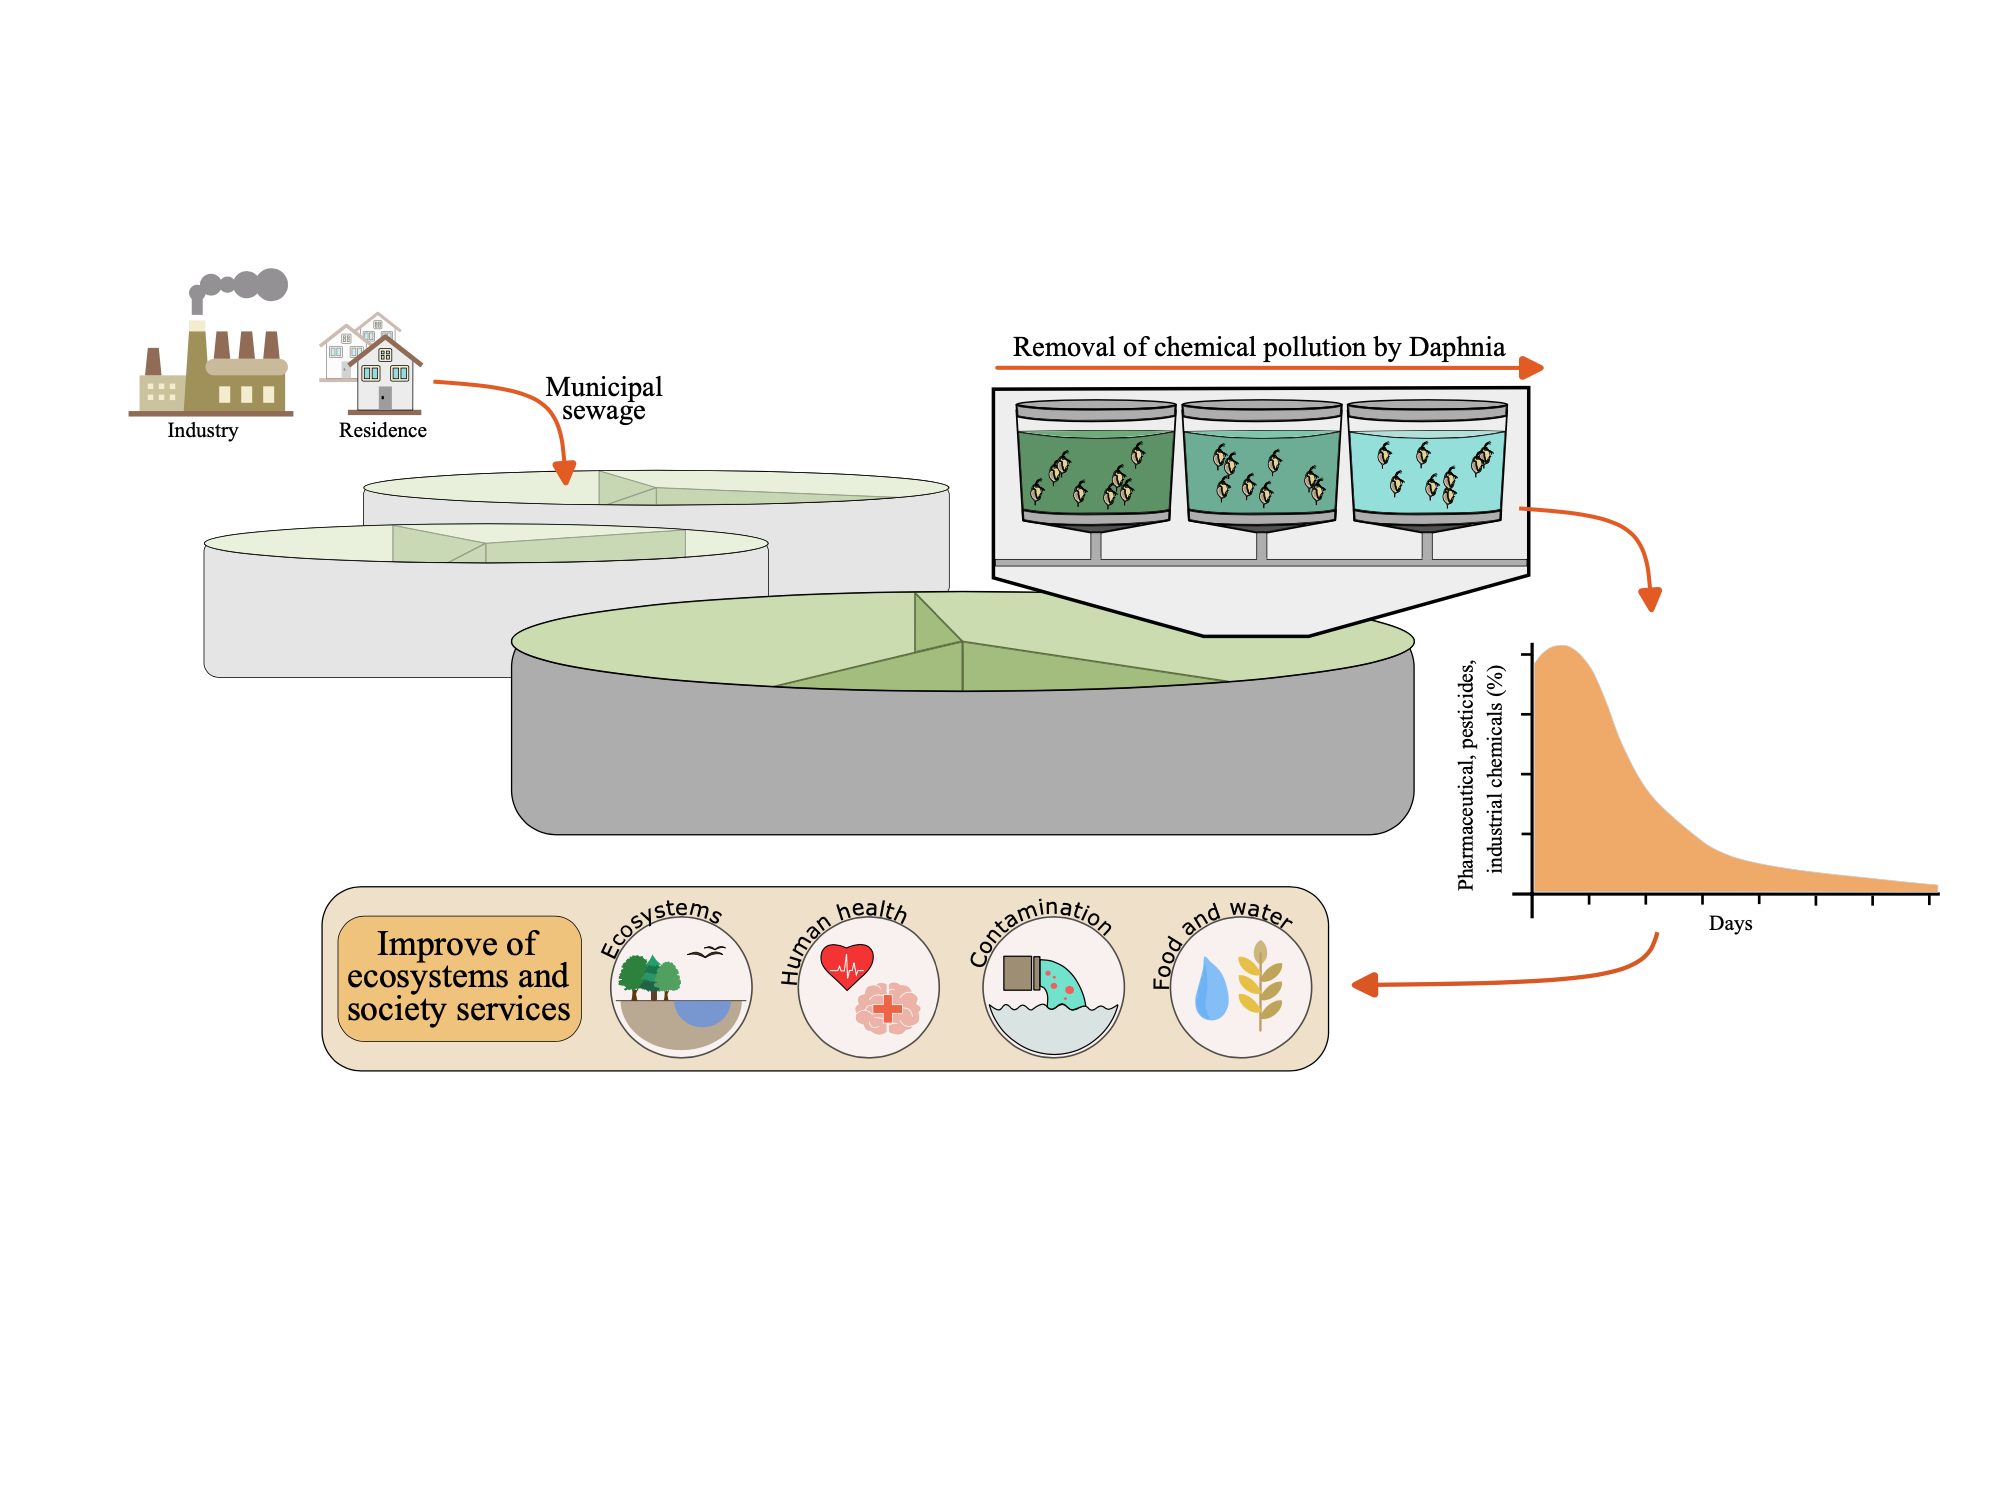
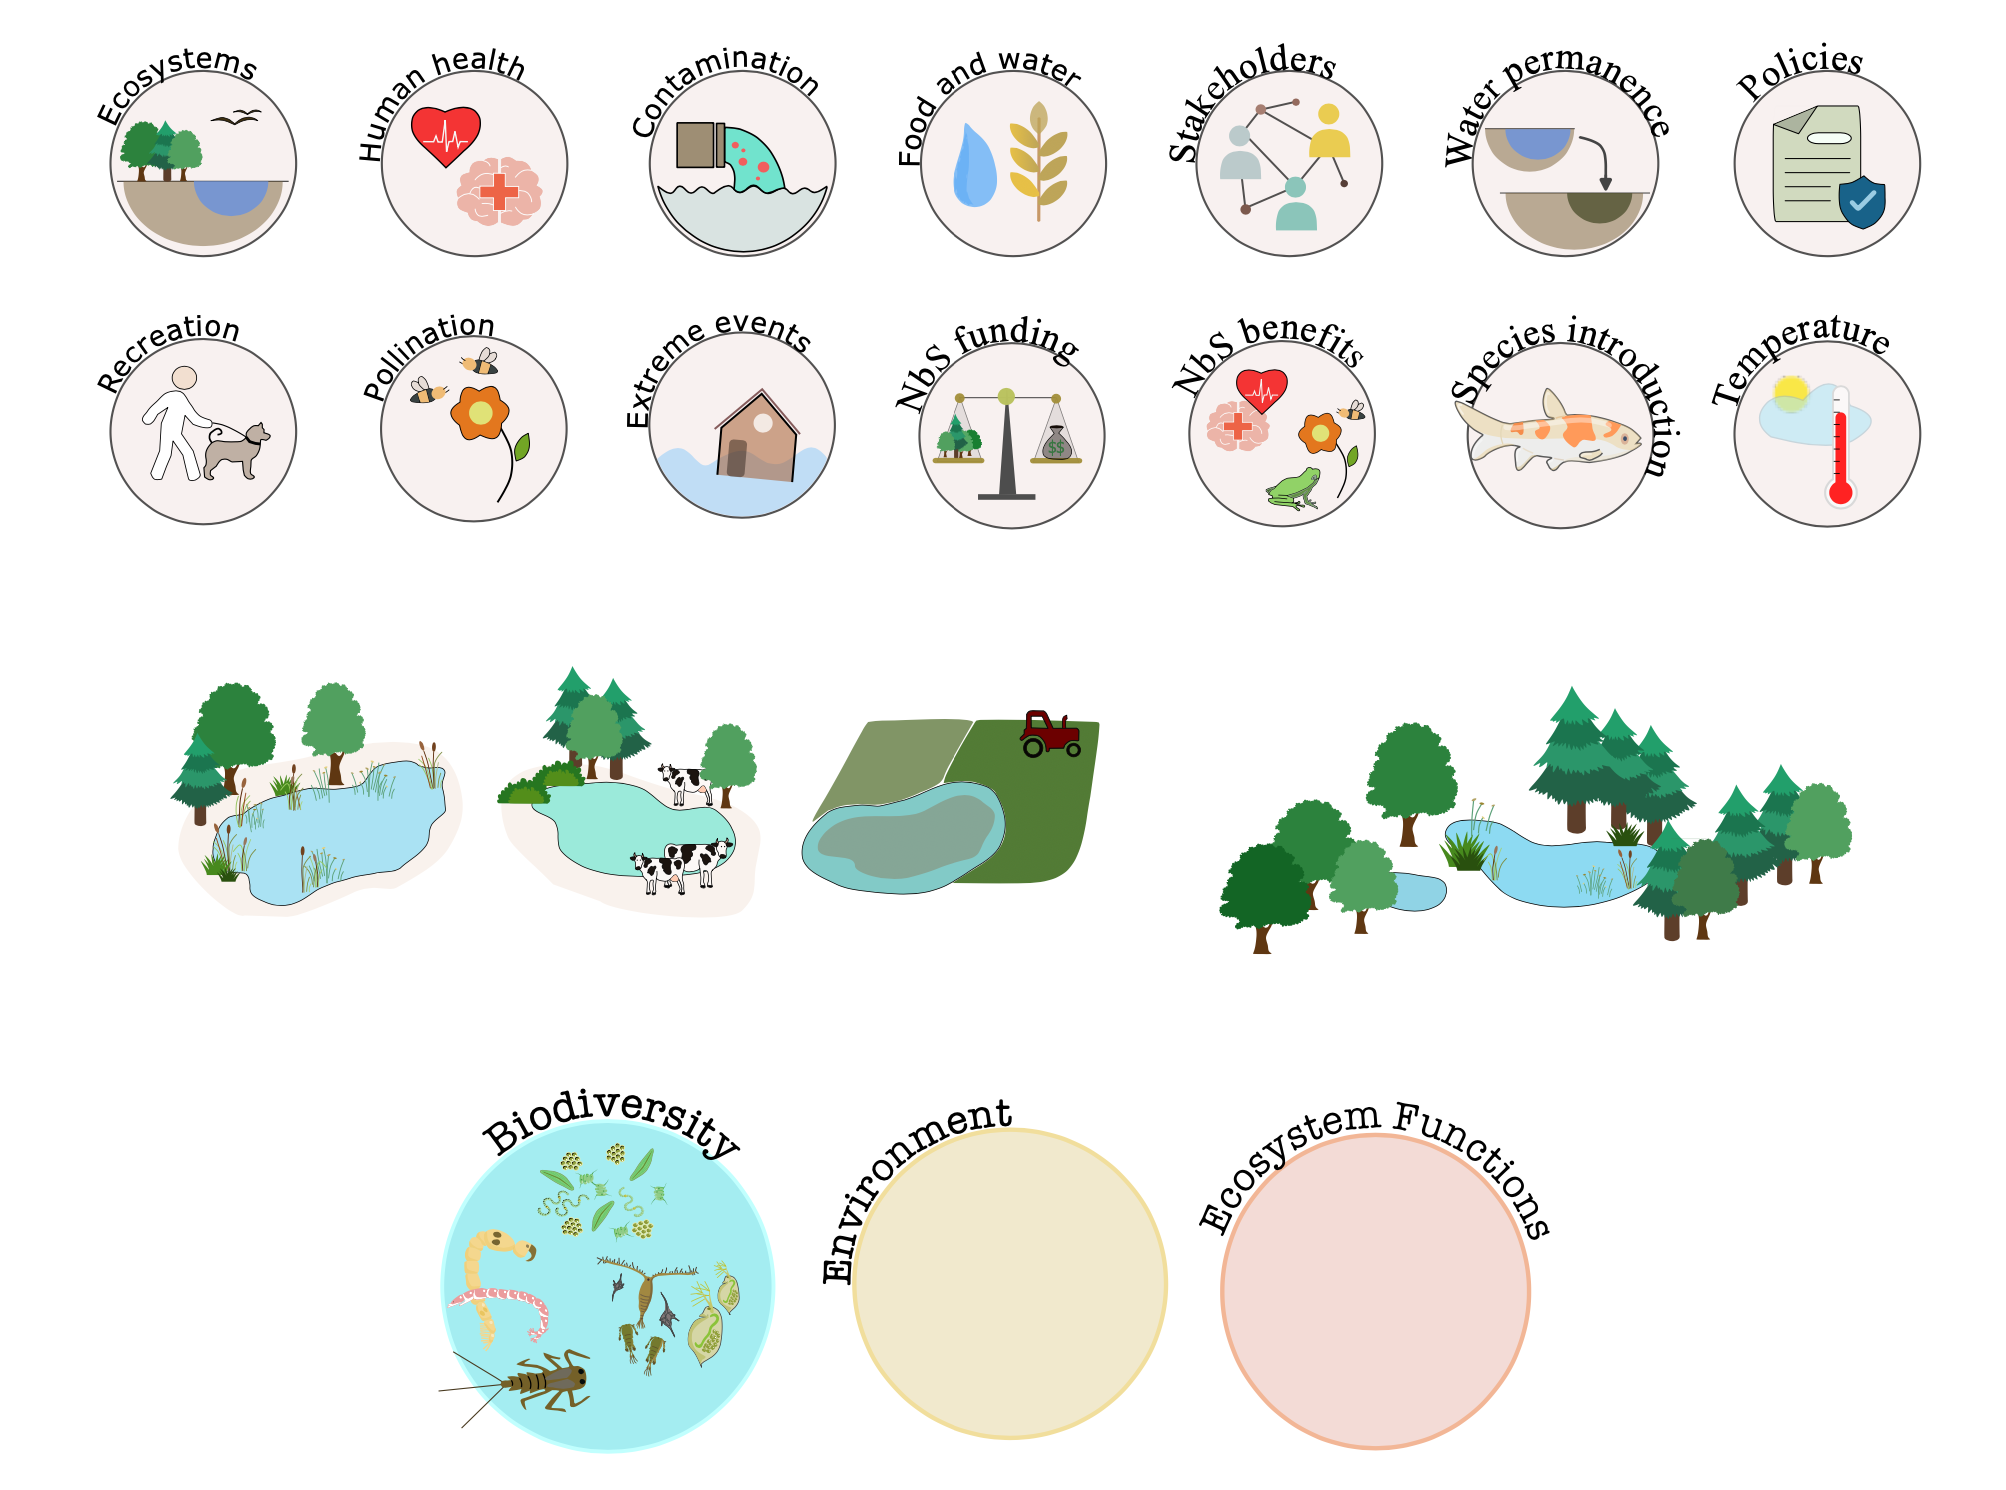
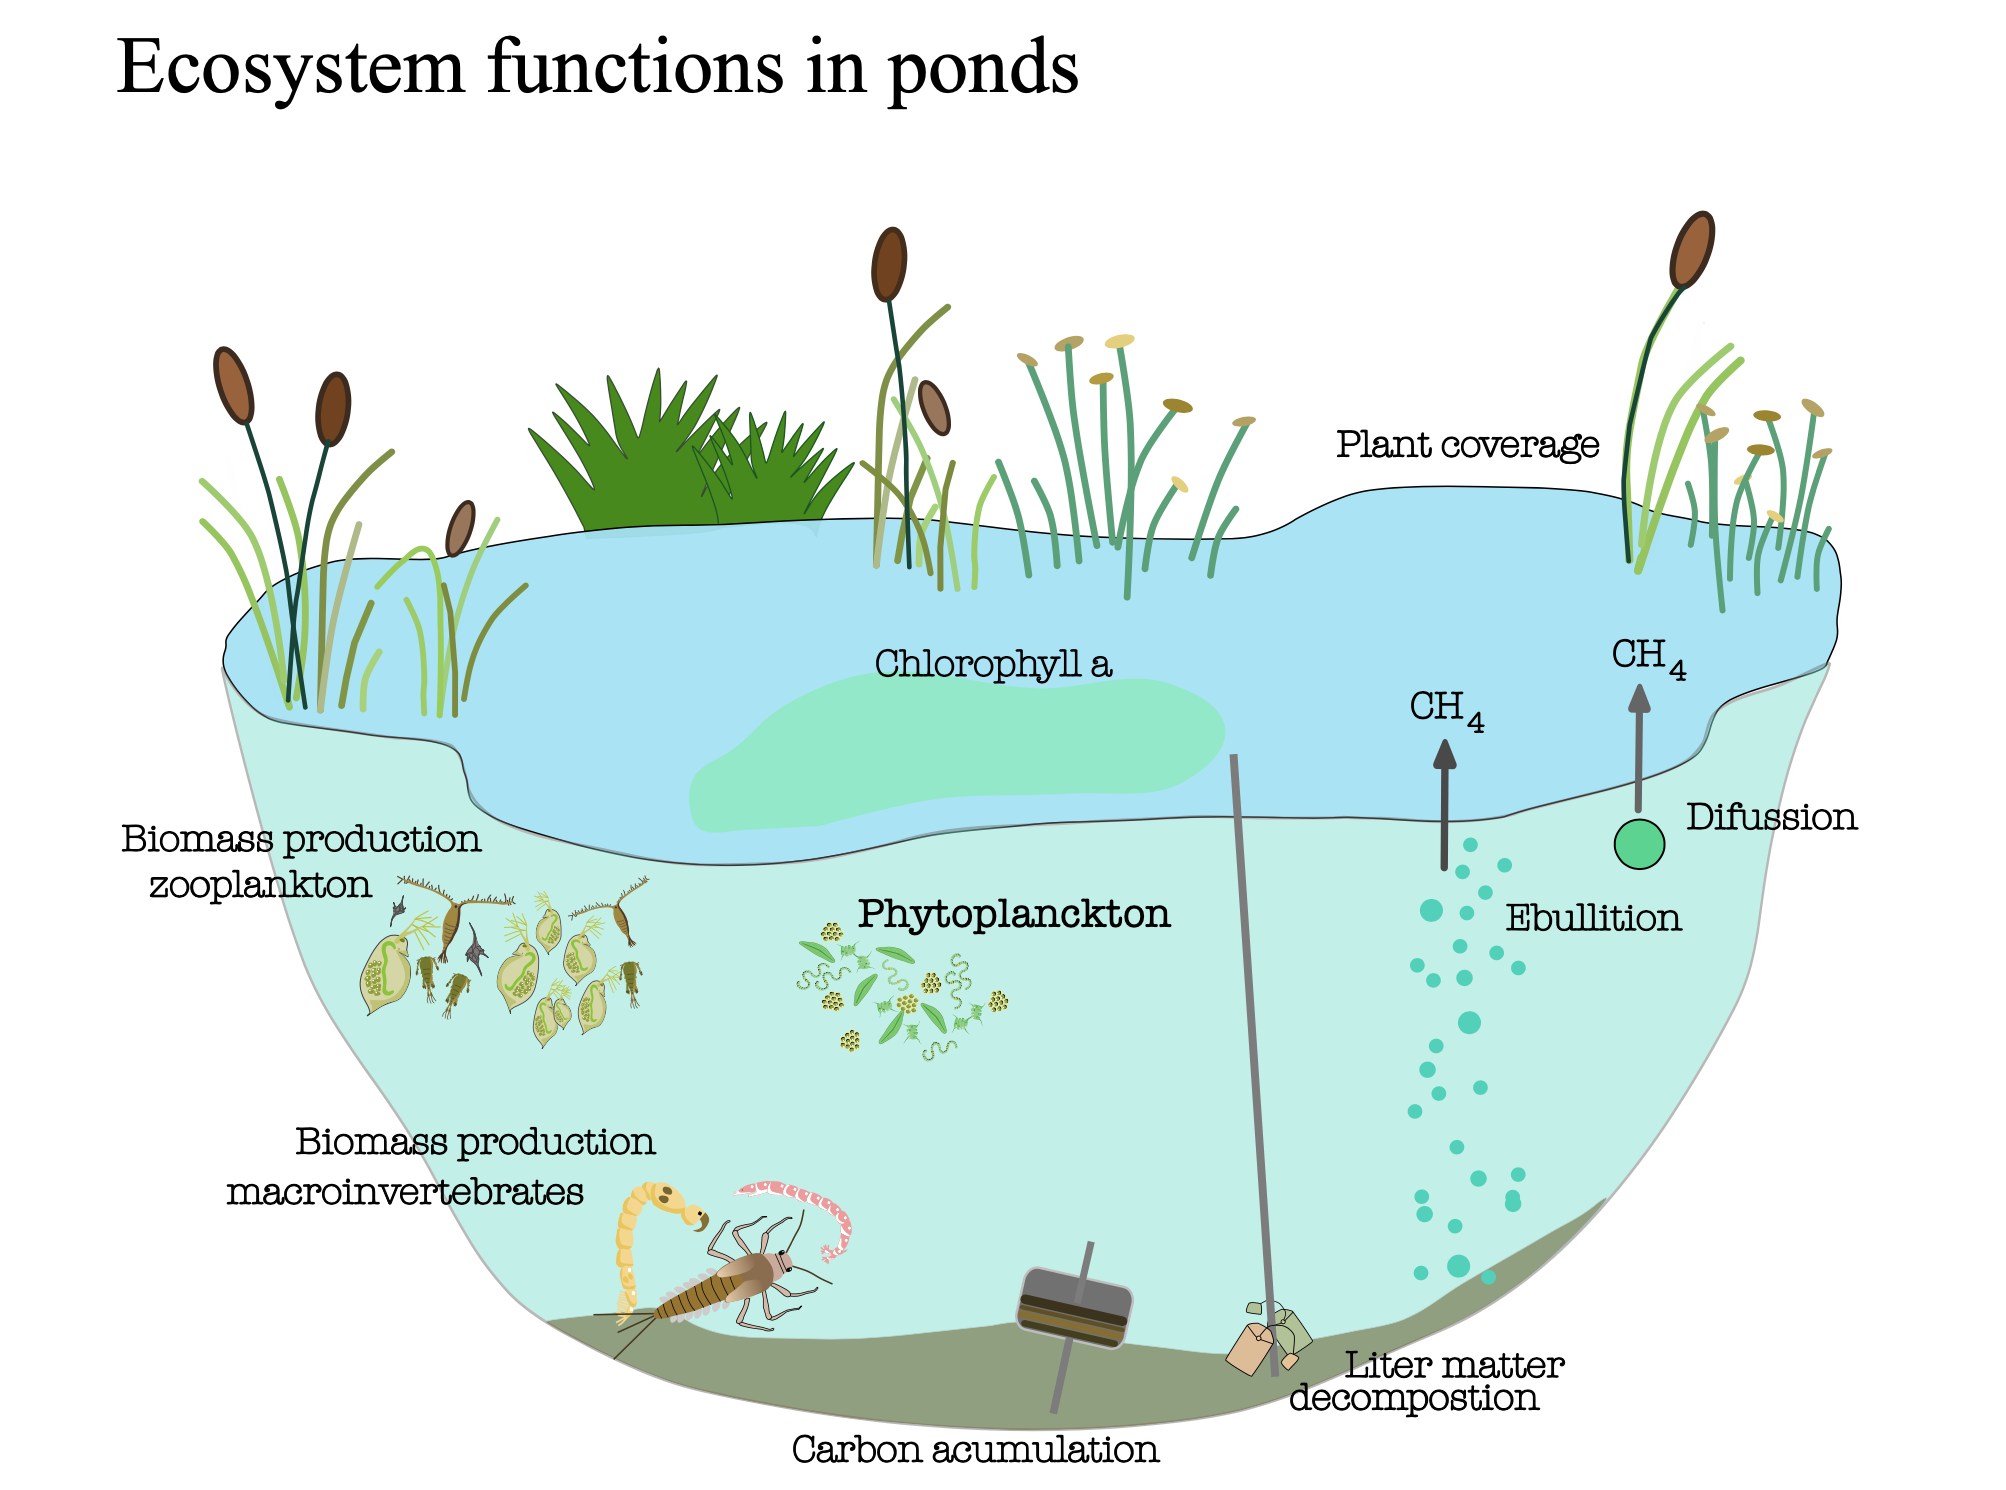
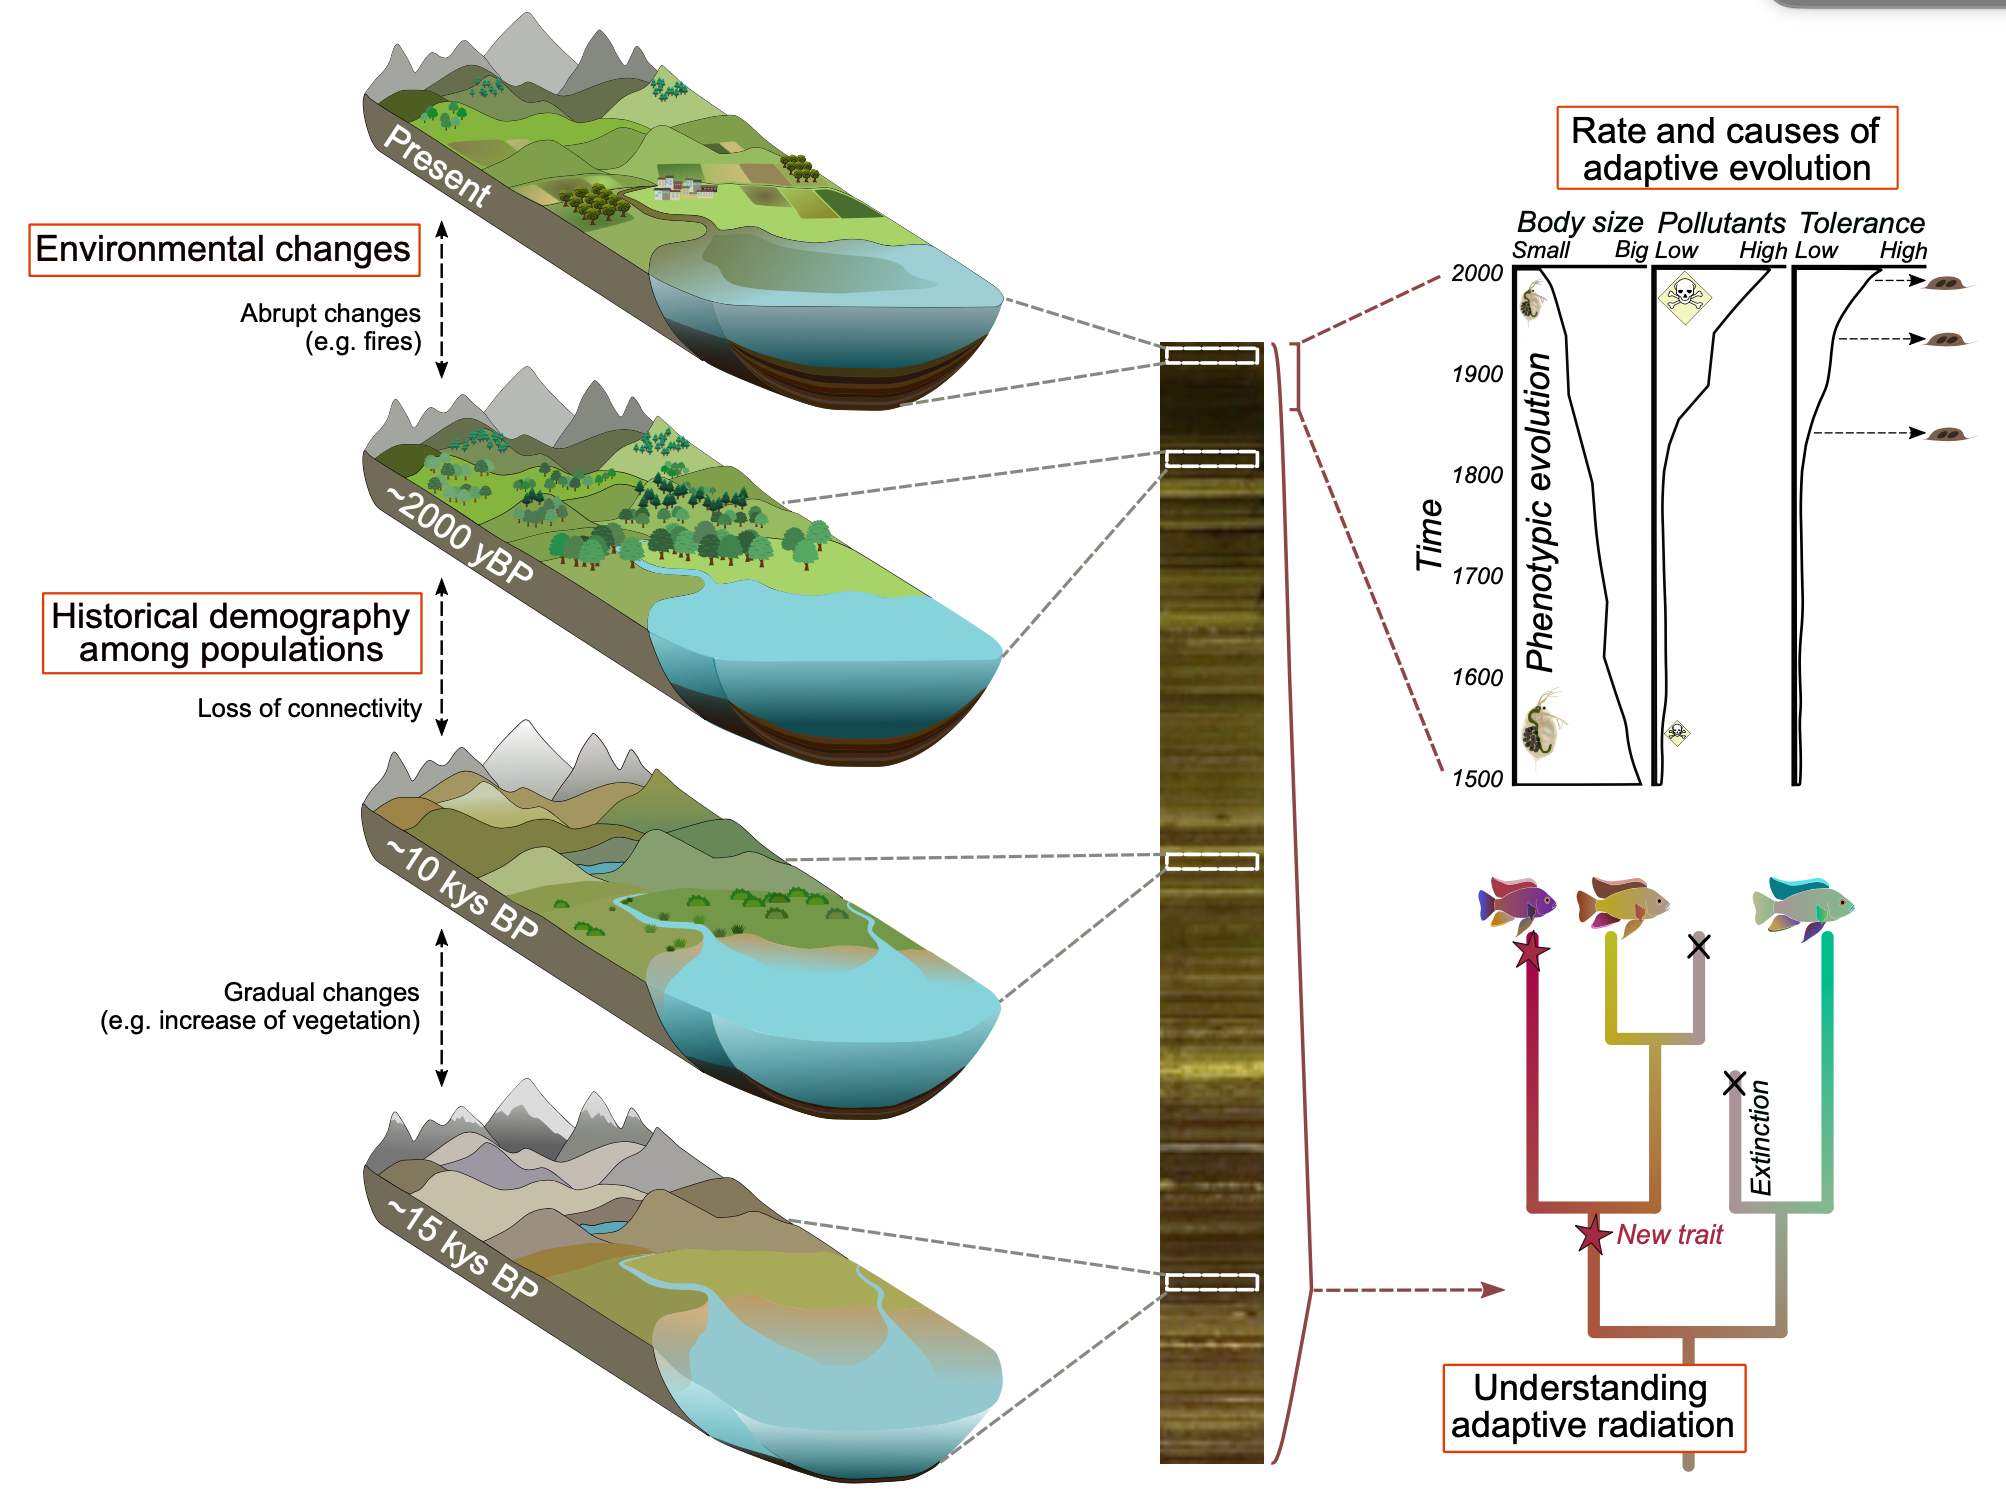
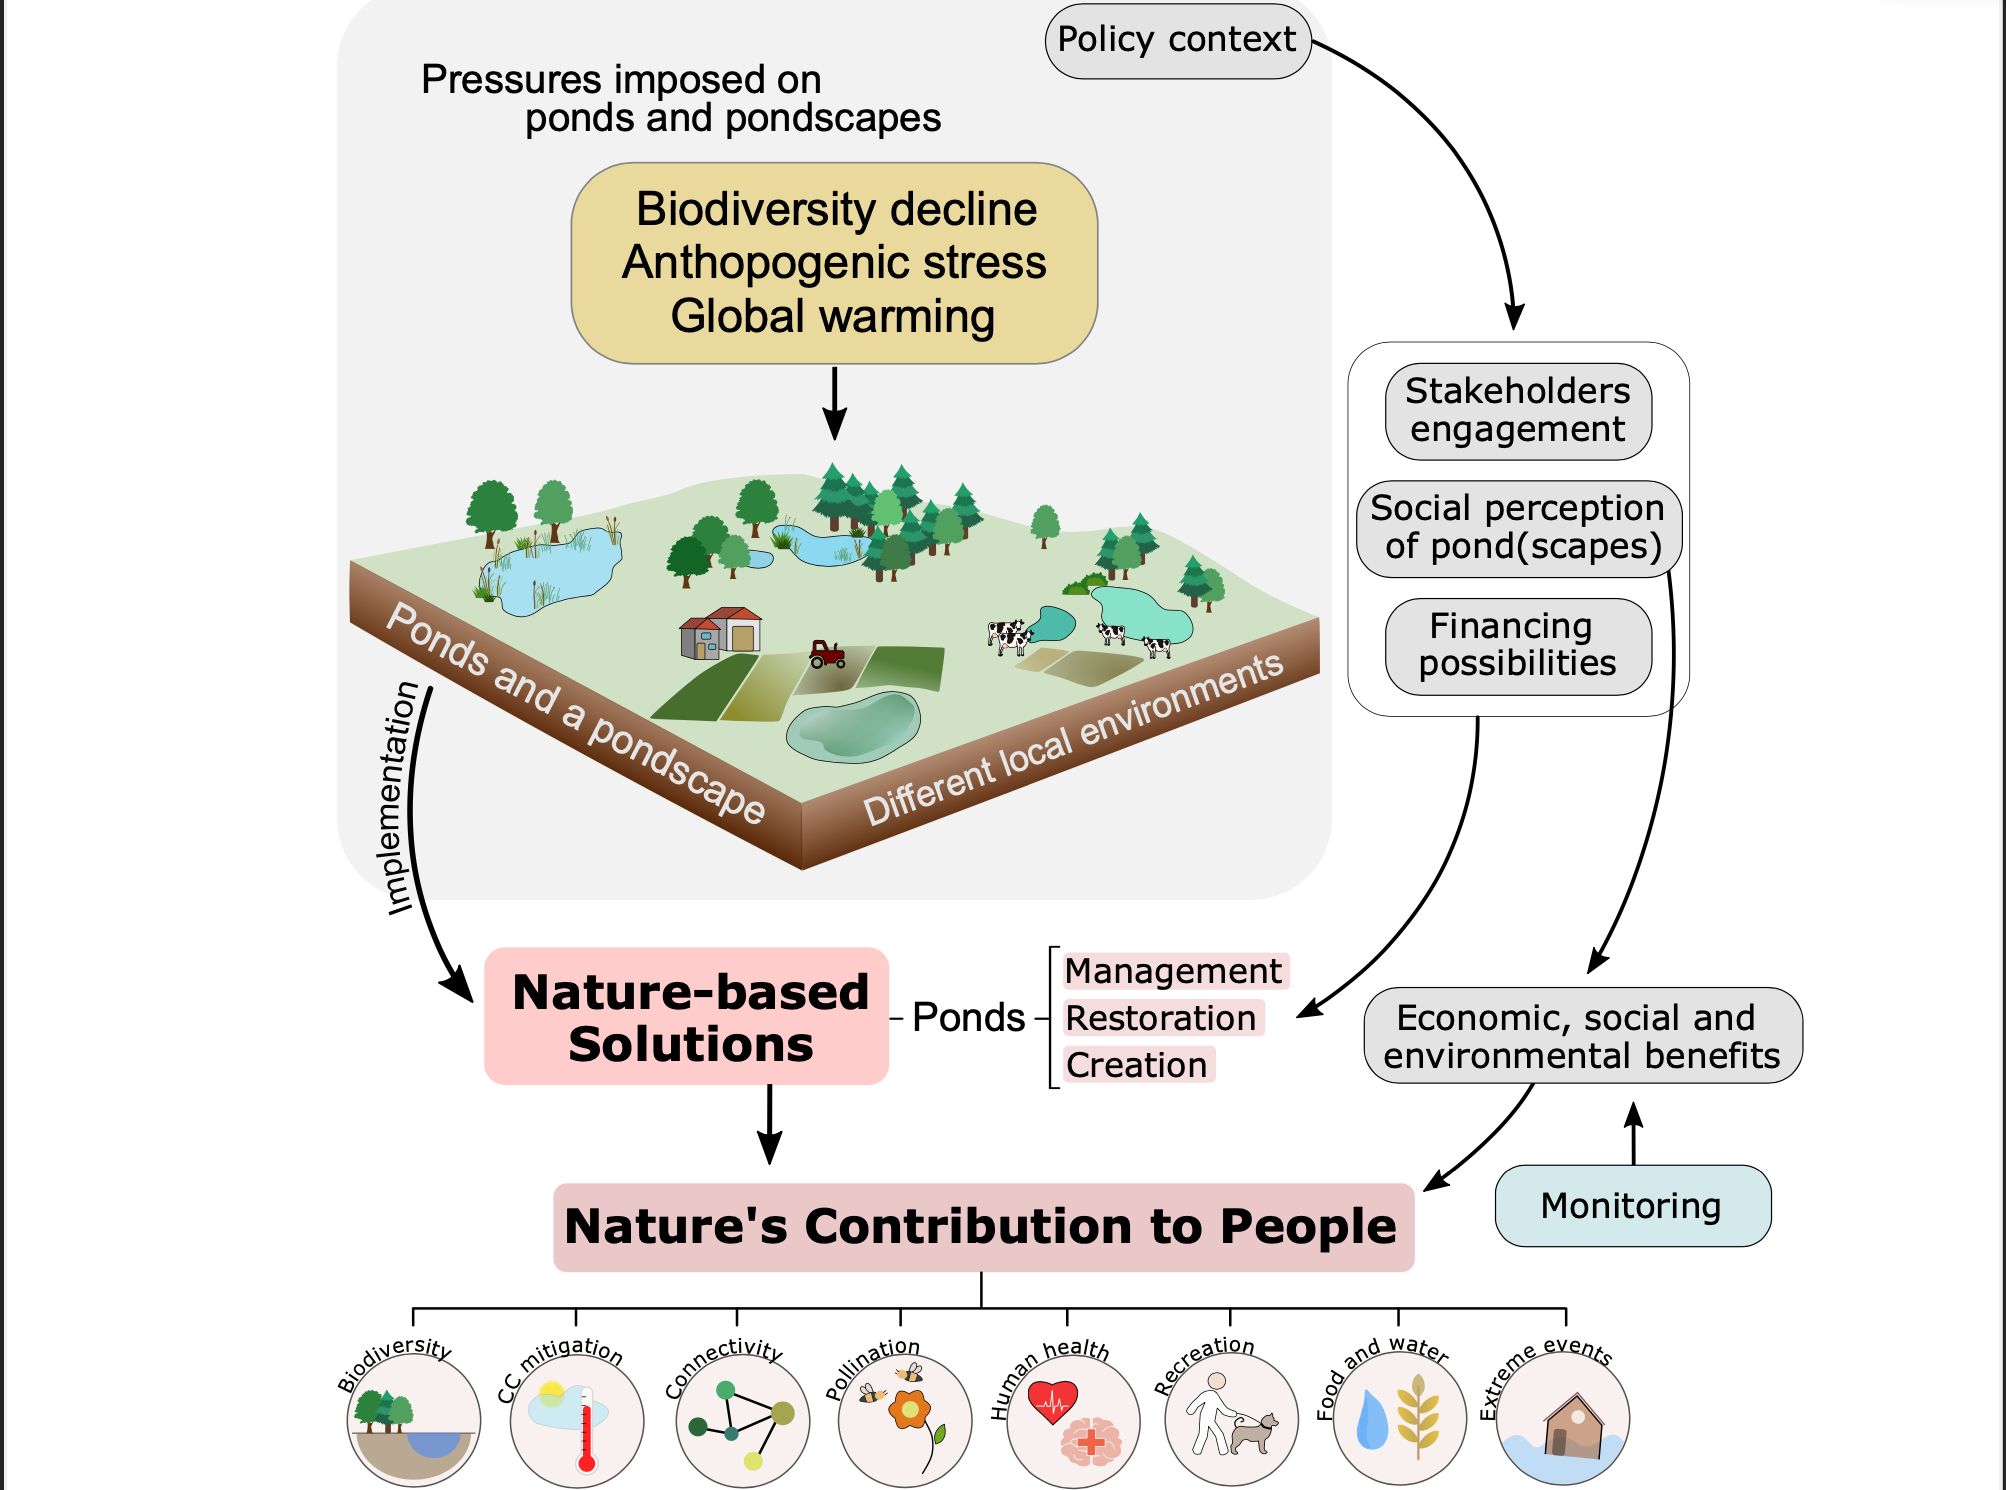
A well-designed figure is one of the most powerful tools for communicating science. Often, it is the figures in a paper that first capture our attention and guide us to the key findings and continuing reading the entire document. For this reason, I always try to create figures and plots that are self-explanatory, visually appealing, and informative, ensuring that illustrations not only support understanding but also enhance the overall aesthetics of a manuscript.
For the creation of the figures, I always use Inkscape, a free software, really friendly and highly recommended.
Here, some examples